Site Navigation
Oilfield expertise at your desktop
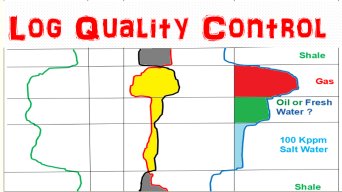
Log quality control procedure
Log Quality Check:- Quality check of all logs available is first step before starting any interpretation.Given below are the details of basic quality check that should be performed on log.Details are not extensive by any means ,its just given to provide the idea on what to look for.
Quality check should be done to assure the quality of log at all stages in the recording of logs.it is the responsibility of both field personnel responsible for logging job and petrophysicist responsible for interpreting the log. Log quality check in field includes identification and elimination of factors, which prevent logs from meeting all quality standards and it should be one of the main aims of log quality check feedback system.
Thorough quality check should be done on logs by both field staff and petrophysicist responsible for interpretation .Factors affecting log quality and interpretation certainty should be identified , marked and documented. Log header ,well data, logging data, parameter data, remark section delay summary should analyzed carefully and if any abnormality is identified than it should also be documented for analyst review. Comparison of main log with repeat section should be done to check repeatability of curves , calibration data should also be analyzed carefully.In order to avoid any confusion related to environmental corrections applied on well site,all the environmental corrections applied on log in well site should be clearly mentioned in comment section of log header for petrophysicist review.
Following factors should be checked carefully:-
1.Tool calibrations: – Tool calibrations at shop, before job and after job should be checked carefully and they should be within specified tolerance for all the logged tools.
2.Depth control: – Depth control should be checked for all runs and individual logs by comparisons of Gamma ray response of the log with that of previous run.Deep resistivity curve peaks should also be compared with peaks of other curve to see the depth match.
3.Tension: – Tension curves should be carefully observed to identify when tool got stuck.
4.Caliper: – Caliper response should be carefully observed for mud cake thickness , Borehole size or presence of swelling clay.Shallow depth of investigation of padded tools such as density and micro-resistivity gets more affected by hole size as compared to other tools.Check caliper data inside casing with known casing internal diameter values.
5.Gamma Ray: – Gamma ray should be observed carefully and it should match with expected formation response,with only exception of radioactive sands. GRkt (gamma ray potassium and thorium) should always be less than GRkut (gamma ray potassium-uranium and thorium).Uranium should never be negative.Any unexpected response should be investigated and explained before starting interpretation.Check curve response in known shale zone.
6. Resistivity: -Resistivity response should be in agreement with the formation logged .Any unexpected response should be checked and explained before starting interpretation. If logging with induction tool any spike should be checked properly especially in high resistivity zones. Check curve response in known shale zone.All three resistivity curves should overlay each other in impermeable (shale) zones.All three resistivity curves should make proper invasion profile as an example in water bearing zone with Rmf > Rw ,Shallow resistivity>Medium resistivity > Deep resistivity and in water bearing zone with Rw> Rmf Deep resistivity > Medium resistivity > Shallow resistivity. If logging with laterolog use Rxo instead of Shallow resistivity.If logging with Laterolog keep in mind micro-resistivity and deep resistivity curves may show differences as micro-resistivity is a padded device and gets affected by hole condition and fractures
7.Spontaneous Potential: – Spontaneous potential response should be in agreement with that expected from the formation. Spontaneous potential should be smooth with no spurious deviations and it should be as noise free as possible. Shale baseline should be clearly observed to be straight without any drift against the interval of study.If logging engineer applies any SP baseline shift in shale section for display purpose,it should be clearly marked on log.Check curve response in known shale zone
8.Density: – Bulk density response should be as expected from formation.Density curve are highly affected by hole washout/rugosity resulting into decreased far uncorrected density and positive DRHO correction on the other hand presence of barite in mud results into increased far uncorrected density and negative DRHO correction. DRHO curve ,positive correction curve and negative correction curves of density should be carefully observed along with caliper data and mud information while doing density quality check. If DRHO is higher than + 0.25 gm/cc,density data is highly questionable.Density should be compared with other curves especially neutron ,any difference should be explained.Generally in clean water bearing formation density porosity and neutron porosity should read same.Photoelectric factor (PEF) is not reliable in heavy mud and PEF cannot be interpreted in complex lithology.Check curve response in known shale zone
9.Neutron: -Neutron response should be as expected from formation.make sure to check environmental corrections applied on neutron by field personnel as neutron gets highly affected by environmental corrections especially temperature .Apart from temperature there is long list of environmental corrections applied on neutron curve .Its always worth to check neutron response in formation in conjugation with density tool.Generally in clean water bearing formation neutron porosity and density porosity should read same.Check curve response in known shale zone.
10.Sonic:-Sonic response should be as expected from formation.There should not be any spike.Casing check should be performed for sonic tool.Delta T compressional inside casing should read around 57 microsecond per feet.Its worth to plot and check the sonic data trend on banana plot if both compressional and shear slowness are available.Waveform should not be saturated and semblance should be strong for given slowness.Sonic data should agree with other data acquired,if there is any difference,it should be explained.Check curve response in known shale zone.