Site Navigation
Oilfield expertise at your desktop
Pressure prediction during drilling
Introduction
Sediment pore pressures are important constraints that need to be carefully considered when planning a new well, and influence drilling strategy, casing program and mud-weights. The pore pressures in sedimentary rock can vary from hydrostatic (normal) pressures to very high (abnormal) overpressures. The variation in overpressure with depth and location in a basin are controlled by a number of factors: overburden permeability and thickness, sediment compaction and diagenetic alteration. In order to give decision support during drilling using computer based systems real time updated pore pressure prediction is needed.
A pre-drill prediction of pore pressures is used as input in the well planning phase. This prediction is based on an assumption of the local geology in the prospect, typically extrapolated from near-by wells. However, the pre-drill prediction may be inaccurate or erroneous due to incorrect assumptions regarding local geology (e.g. sediment properties) or sub-surface fluid flow patterns (fault properties, lateral communication).
Method
In this article we present a system for real time drilling simulation, 3D visualization and monitoring of the drilling process, from a remote drilling expert centre . The concept uses all available real-time drilling data in combination with real time modeling to monitor and provide advisory for more optimal drilling. This information is visualized in real-time in a graphical user interface . The core of system is an Drilling Simulator, capable of modeling the different drilling sub-processes dynamically, and also the interaction between these sub-processes in real time. The Drilling Simulator consists of a set of advanced dynamic models that calculate the well conditions based on all available data from the drilling process. In addition to calculating important properties such as pressure, Equivalent Circulation Density (ECD), torque etc, the simulator can also provide diagnostics, that is, warnings and advice based on measured and calculated data. For instance, system can warn the user if there is a danger of kick or loss situations. In order for these warnings to be representative for the well situation, it is very important that the data that system bases its warnings on are reliable. For instance, formation properties such as the formation pore pressure should represent the present state of the formation. In many cases, the available pore pressure data are obsolete, and the need for updated data is crucial in order to be able to make a proper diagnose.
Pore pressure prediction
The simulator is developed to calculate pressure build up and dissipation on geological time scale in sedimentary basins . The fault traces mapped at the top reservoir level delineates the lateral extent of the pressure and stress compartments that are used in the simulator. The lateral Darcy flow of formation water across low- permeable faults is calculated using an explicit forward Euler solution technique. Depth-converted maps of the overlying sediments are used to construct the burial history that is adjusted for decompaction. The development of pressure and stresses are reported for a series of time steps. Time steps are correlated to the depositional ages of the stratigraphic horizons that are used to build the model. Porosity-depth relation in the shales is used to model mechanical compaction and a kinetic model for quartz cementation is used to model chemical compaction of the sands. Hydrocarbon migration is not taken into account that presents one-phase simulation.The geo-mechanical properties for the caprock are allowed to vary through time with changing burial depths. Isotropic horizontal stresses are assumed and the minimum horizontal stress is estimated using an empirical formula. The vertical stress varies versus time depending on sedimentary loading. No strain is included and a passive sedimentary margin is assumed. Fault permeability is modeled as depth dependent. The fault transmissibility depends on the burial depth, the length, width and the dip-slip displacement of the faults, thickness of the reservoir layers and the permeability inside the fault block . Juxtaposition faults have high transmissibilites, while faults with no overlap have lower transmissibilites. The Griffith-Coulomb failure criterion and the frictional sliding criterion are used to simulate hydraulic fracturing from the overpressured compartments.
Stochastic modeling
As outlined in Krogstad & Sylta (1996), Sylta & Krogstad (2003) and Sylta (2004), 3D hydrocarbon basin simulations can be carried out using Monte Carlo simulation.The same methods can be used to simulate pressure versus depth in wells. Sylta & Krogstad (2003) assumes, building on the study from 1996, that at least 1000 runs are required in each applications to make reliable fluid flow predictions. This, since fluid flow is a non-linear problem to solve.Sylta & Krogstad (2003) used a probabilistic description of the key input parameters like e.g. thickness of source rock unit as the sum of a) a map grid of the most likely values and b) a standard deviation from the most likely values. This can also be used in our case, where the most important input variables can be described with a deterministic distribution.
Minimum and maximum cut-off values should be used, when using normal distribution to avoid negative values, resulting in a truncated normal distribution (Sylta & Krokstad 2003). The calibration of the model consists of finding a set of input variables and their values that results in a match to 1.present-day pressures versus depth in wells & 2.present-day stresses versus depth in wells
Pre-drill pressure prediction
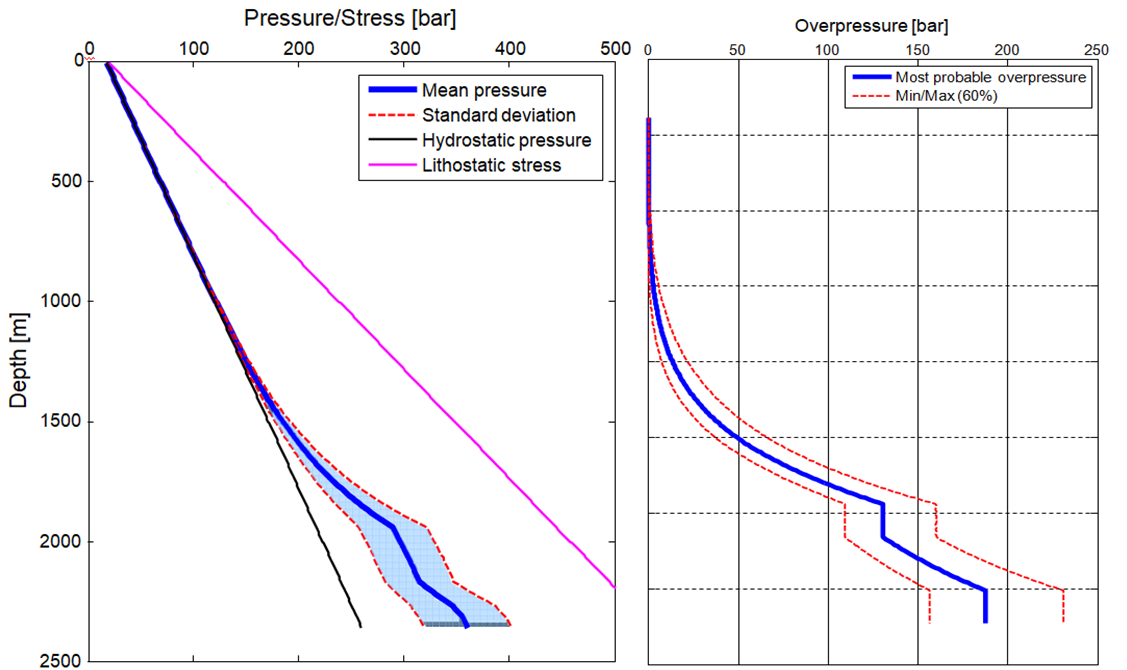
Before drilling, pressure is modeled in the pressure cell (bordered by geological faults) where the well is located. The model is run several hundred times where parameters not known for certain influencing the over pressure are varied slightly. Each simulation results in a pressure prognosis for the well. The mean result as well as the std. deviation is depicted together with the hydrostatic and lithostatic pressure. With greater depths the uncertainty in pressure increases Pressure prediction while drilling.During
drilling real time resitivity and sonic
data is used for pressure prediction. Using these measurements the pressure is calculated,
Equation for Eaton’s method is given below:
Resistivity:
Pobs= s- ( s- pn) ( RSh,obs /Rsh ,n)nr
with nr = 1.2
Equation of pressure from sonic log using Eaton’s method
Pobs= s- ( s- pn) ( ΔTSh,obs /ΔTsh ,n)ns
with ns = 3.0
s = Overburden stress (Pa) and is given as a function of the average formation bulk density.
pn = Normal pore pressure (Pa) and is a function of the average formation fluid density.
RSh = Shale resistivity (Ùm)
ΔTSh,= Shale travel time (s/m)
Note that subscript “obs” refers to the observed (actual pressured) condition and subscript “n” refers to the hydrostatic (normally pressured) condition.
The corrected drilling exponent for normally compacted/pressured formation can be inferred from offset wells at the same depth, or from extrapolation of trend data in the normally compacted/pressured formation.
From
the Monte-Carlo runs and the observed pressure calculated from the resitivity,
sonic, and drilling exponent can calculate weights wi given to each simulation run i, based on the log data information. In basin modeling, these
weights are calculated based on observed pressures Pobs from a calibration measurement using below
equations:
wi= N / ( ∑an (pnmod(i) –pnobs)2
where N is the number of calibration depths, ‘n’ refers to the well depth, an is a weight of importance applied to each calibration
depth.
pmod(i ) is the modeled overpressure
for depth ‘n’ in run ‘i’, and
pobs is the observed (measured)
overpressure for the calibration depth. An estimator for the most likely value of p is then
p= ∑ pmod(i) wi/ ∑wi
In this implementation we calculate pobs as the arithmetic average of the pore pressure calculated according to resistivity, sonic and drilling data. If one of these is missing, it is ignored.
Discussion
Log data can be highly variable over short depth intervals. Pore pressures calculated based on the log data also has quite a large spread. Using the pore pressures calculated from log data to weight the pre-drill Monte Carlo results seem to have the effect of regularizing the prediction, thereby avoiding the noise seen in the log- based calculations.If during drilling the pre-drill model is found to be too inaccurate, the weighting procedure will not work properly, and the predictions ahead of the bit will not be optimal. Errors in the pre-drill model can be caused by errors in the geological model eg. wrong depths of formation tops or actual lithology being different from the expected model. The Monte Carlo simulations should then be updated and re-run to honor the actual geology and pressures at the depth of drilling. The update can be done in a matter of hours.
Lithology effects are important on log responses. A more detailed lithology model that what is used in this example may be necessary if abrupt changes in sediment permeability, and thereby also in pore pressure, is expected.
Conclusion
Real-time updated pore pressure predictions is of vital importance for advanced computer based systems for online supervision and decision support during drilling, such as in Integrated Operations. Early warnings can be supplied if abnormal overpressures are to be expected ahead of the bit, or if measures should be taken to avoid dropping below the pore pressure. As shown in the example, the pore pressure predictions ahead of the bit are improved when updating predictions based on Logging-while-drilling data.
The novel combination of automatically updated pore pressure data during drilling with an advanced real-time integrated drilling simulator provides a powerful tool for next generation drilling .