Site Navigation
Oilfield expertise at your desktop
Water Flow Logging
Water flow logging part of pulsed neutron logging ,it is based on principle of oxygen activation. It quantifies the amount of oxygen flowing in and outside the casing. As oxygen is only present in water in borehole environment, it acts as a water flow log. In this mode quantitative velocity measurement of activated oxygen atom present in slug is done. This measurement can be done in tool stationary mode at different stations or tool moving up-hole. Stationary mode is useful in quantifying water velocity with better accuracy.
Water flow log helps in identifying well integrity issues and identification of water producing zones. Both the issues are very critical during the production life of well.
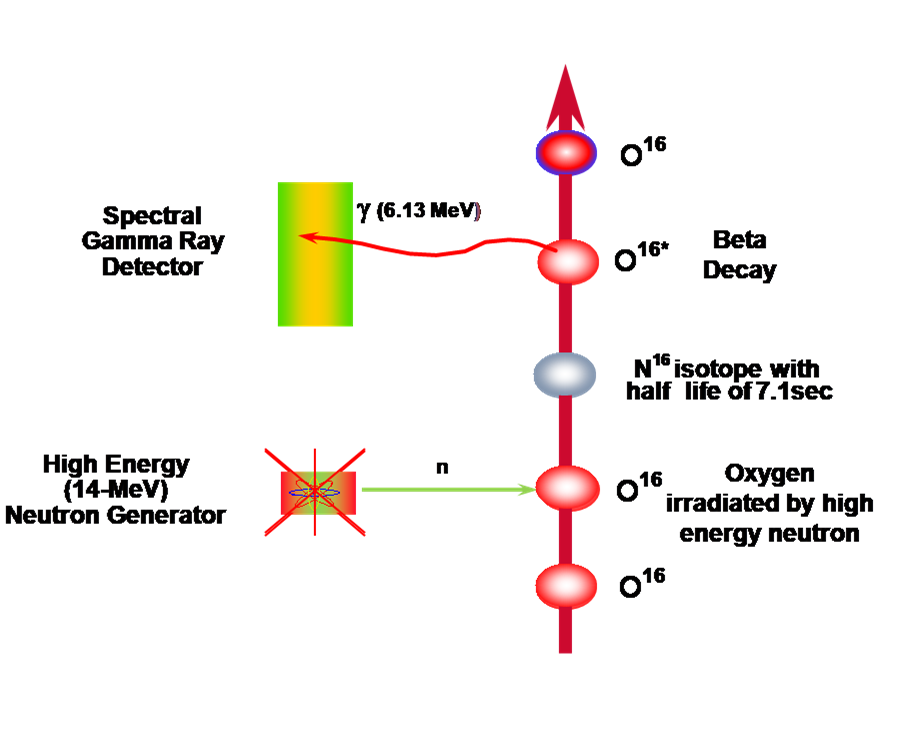
When oxygen atom travelling through borehole is irradiated by high energy neutron emitted by neutron generator, it produces an isotope of nitrogen 16 this nitrogen 16 decays back to oxygen with half life of 7.1 seconds and emits gamma ray at 6.13 mev level. This 6.13 mev gamma ray is detected by Pulsed neutron detector and counted in tool to estimate amount of oxygen flowing in and around borehole which correlates to amount of water flowing in and outside the casing. As distance between pulsed neutron generator and specific detector is known, time difference between neutron burst and recorded gamma ray peak provides water flow velocity. Determination of water velocity is easier and very accurate in station readings. Quantity of water travelling through well bore is determined by amplitude of Gamma ray peak.
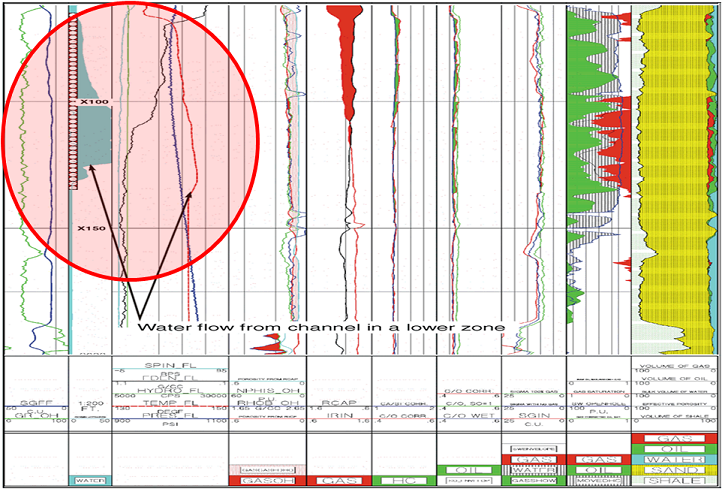
Below image shows a very basic example of oxygen activation water flow log done using pulsed neutron data in well flowing condition from an SPE paper 71718,
First track shows Gamma ray open hole and sigma, second track is depth track with perforations marked and oxygen activation curve plotted. Track 3 is having Production logging curves including flowing condition temperature as red curve.
If we look at track two, we can see there is a jump in oxygen activation marked by arrow, this is indicating upwards water flow starting from that zone. In the next track temperature curve from Production logging tool is also increasing in that zone, indicating that water is flowing from channel in bottom part of well.
This example is from pulsed neutron tool logging upwards. This is a very simple example of analyzing oxygen activation curve ,lot more information’s on water flow can be extracted using oxygen activation logs, like comparing it with background activation can also help in interpretation if flow in within the casing or outside the casing.
Few things to keep in mind while interpreting the oxygen activation log.
1.The water flow rate must be upward relative to tool i.e speed of water must be greater than logging speed to get detected if it’s not station reading.
2. Amount of water flow affects the size of signal.
3. Relative velocity and decay rate affect the size of signal. The maximum signal occurs at the detector when water velocity relative to tool is V= 5.657 X L where L is source to detector spacing.
To discuss this article with author, do contact us at support@oilfieldknowledge.com .