Site Navigation
Oilfield expertise at your desktop
Carbon-Oxygen Interpretation
Carbon-Oxygen Interpretation for reservoir monitoring in unknown or fresh formation water
Carbon-Oxygen (C/O) interpretation is used for oil saturation evaluation behind casing. As C/O interpretation is based on carbon and oxygen index of reservoir fluid, this interpretation is independent of formation water salinity.
This article is fifth in series of articles we are writing to cover cased hole formation evaluation. We encourage you to read previous articles written in this series especially introductory article Cased hole formation evaluation and to understand challenges in acquiring inelastic mode data please read article Pulsed neutron physics and Pulsed neutron detectors.
Before starting to work on Carbon-Oxygen interpretation we should review basics of Carbon-Oxygen interpretation.
As already discussed in above mentioned articles, primary data for Carbon-Oxygen (C/O) interpretation is acquired at high energy inelastic range which is between 8 to 14 mev. Pulsed neutron generator produces high energy inelastic neutron of energy 14mev in a short burst. Collision of these neutrons with different elements of formation results into high energy inelastic collision. This high energy inelastic collision takes the formation and borehole environment nuclides into excited state. These nuclides de-excite themselves by emitting gamma rays of characteristic energy level, depending upon their atomic number. Data recorded in this mode are used to get values of Carbon-Oxygen ratio,Calcium-Silicon ratio, Inelastic count rate and various inelastic elemental yields from both near and far detector.Other measurements are near to far inelastic count ratio and inelastic to capture ratio. Inelastic mode Carbon-Oxygen data has depth of investigation of 6 to 8 inches. Acquiring high energy inelastic data leads to high statistical uncertainty hence it is recommended to log 3 to 5 passes at stable logging speed of around 3 ft/min.
As carbon is associated with oil and oxygen is associated with water, carbon-oxygen (C/O) ratio is a direct indicator of oil saturation in reservoir, carbon-oxygen ratio is high in oil zones and low in water zones.Only issue in oil saturation indication from C/O ratio is lithology as carbonates have carbon in their lithology, for example Limestone is CaCO3 and Dolomite is CaMg (CO3)2.Further majority of big reservoirs in the world are carbonates mainly limestone and dolomite. Due to presence of carbon in carbonate C/O ratio in carbonates increases even with the absence of any oil in reservoir. This problem is solved by proper characterization of tool for different lithologies and using Calcium/Silicon (Ca/Si) ratio as lithology indicator. Ca/Si ratio will be high in front of carbonates but in clastics it will be low.
Pulsed Neutron tool characterization:
For correct Carbon-Oxygen interpretation, Pulsed neutron tool needs to be characterised. Characterization takes care of variability’s in measurement in different lithologies and fluid types and also due to variations in tool electronics, detectors and generators. Each of the major vendor has its own characterization lab for characterizing the inelastic data measurement as per fluid type and lithology. In these characterization labs several test pits having various lithologies and fluid types are present, tools are characterized in these test pits for developing algorithm for inelastic interpretation.
Data extraction:
Various elemental yields such as Carbon yield, Oxygen yield, Calcium yield and Silicon yield is obtained from inelastic spectra recorded by tool. Basically there are two methods available for obtaining elemental yield they are 1. Windows method and 2.Analysing whole spectra.In windowing or windows methods a window around the most prominent characteristic energy peak of particular element is created to estimate its elemental yield. Windows method has lower accuracy but is having high precision due to its better statistics. In whole spectra analysis, elemental signature of elements is matched for entire spectra. As elements have more than one characteristic energy peak and analyzing whole spectra takes care of each of the peak, this method results into more accurate estimation of elemental yield as compared to windows method but precision of this method is lower than windows method. Different interpretation workflows normally use either of mentioned method for estimation of elemental yield as a result their data has either lower accuracy or lower precision, However one of the service company Schlumberger in their algorithm uses a mathematical model called alpha processing to enhance both accuracy and precision. In alpha processing data from both windows method and whole spectra analysis is combined to get elemental yields with enhanced accuracy and precision. Estimated yields from each detector are used to measure C/O ratio, Ca/Si ratio for both near and far detectors.

Figure:- Inelastic spectra of different elements from a pulsed neutron tool.Kindly notice element are having more than one peak.
Interpretation:
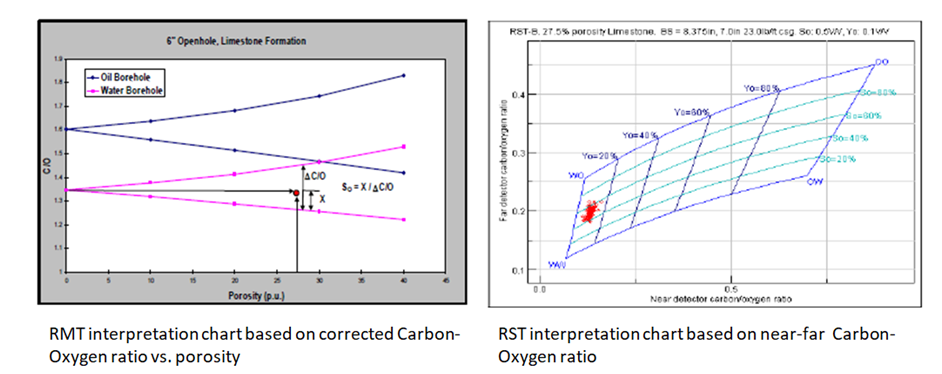
Service companies have taken different approaches in interpreting inelastic C/O data for oil saturation. Schlumberger’s RST-D tool having shielding to focus its near detector to borehole and far detector to formation makes a parallelogram of Far C/O ratio to Near C/O ratio for given porosity on the basis of data base created through characterization.On the other hand Halliburton’s C/O interpretation module is based on Fan Chart which is a plot of C/O ratio corrected to base set of condition vs porosity. Baker uses interpretation approach which is called dynamic response generator.
Response equation for Schlumberger’s parallelogram interpretation method is as given below:
C/O = (K1 + K2* Phi* So + K3 *Yo ) / (K4 + K5 (1-So) + K6( 1-Yo) )
In the above equation C is carbon yield ,O is oxygen yield, Phi is porosity ,So is oil saturation and Y0 is the borehole oil holdup. The coefficients Ki represent the sensitivities of matrix, formation fluid and borehole fluids to carbon and oxygen. The values for these coefficients are determined in calibration test pits.
Halliburton uses windows method for estimation of elemental yields. C/O data Response equation’s for oil saturation using Halliburton’s fan chart is given as below:
LIRI = (0.32 *Vls + 0.30) * (1- Phi) + 1.505
Where LIRI is Ca/Si ratio also known as Lithology ratio, Vls is volume of calcite and Phi is porosity.
Delta CO = COIR – 0.15 *LIRI + 0.07 *Phi – 0.263 +A
Where COIR is C/O ratio environmentally corrected and bring down to base set of condition,Phi is porosity, A is constant to take care of residual effect.
Soil = 1.53 * ((1 -0.35 *Phi)/Phi) – ((Delta C/O)/ (Delta C/O + 0.19 * Chc))
In the above equation Soil is oil saturation estimated using delta C/O and Chc is carbon index of oil.
Graphically fan chart and parallelogram are shown as below:-

Baker in their interpretation module uses a method called Dynamic Response Generator (DRG). DRG uses a database of thousands of laboratory measured environments which relate C/O ratio to oil saturation value.
Dynamic range of C/O ratio vs oil saturation gets lower with decreasing porosity as a result slight change in C/O ratio may lead to huge and unreasonable change in oil saturation in low porosities. Due to this reason porosity less than 12% are not considered for oil saturation interpretation using C/O ratio.
Below Plot is an example of C/O interpretation comparison with Elemental Log Analysis ELAN Sw interpretation. In the below example we can clearly see in track 5 that Oil water contact has moved to 7752ft from earlier 7750m. High Carbon-Oxygen ratio from 7702 to 7709ft is coal seam.

Although we have briefly covered the basic principles behind inelastic C/O interpretation but it is very important to note that understanding of these types of interpretations comes after practically interpreting numerous logs. In order to keep article within given length we have not tried to cover lots of examples. To discuss this article with author, do contact us at support@oilfieldknowledge.com . We are a team of highly experienced geoscientist with global interpretation experience and would love to discuss technical articles with our readers.
References:-
- Many Facets of Pulsed neutron Cased hole logging.IvannaAlbertin et.al.
- Modern Carbon/Oxygen Logging Methodologies: Comparing Hydrocarbon Saturation Determination Techniques ,90339-MS SPE Conference Paper – 2004
- Field Experience with a New Carbon/Oxygen Logging System in Complex Wellbore and formation Conditions ; SPE 71718