Site Navigation
Oilfield expertise at your desktop
Sigma Saturation Interpretation
Sigma interpretation is used for cased hole saturation evaluation in reservoirs having high formation water salinity.
This article is fourth in series of articles we are writing to cover cased hole formation evaluation. We encourage you also to read previous articles written in this series especially introductory article Cased hole formation evaluation.
Let’s review basics of sigma, before starting to work on interpretation. Sigma is defined as capture cross section of formation;it is relative ability of formation for capture reaction to occur. Sigma is measured using neutron induced capture decay time measurement. It is calculated as 4550 divided by tau where tau is time in micro second in which neutron population falls to 36.8% of its original value.
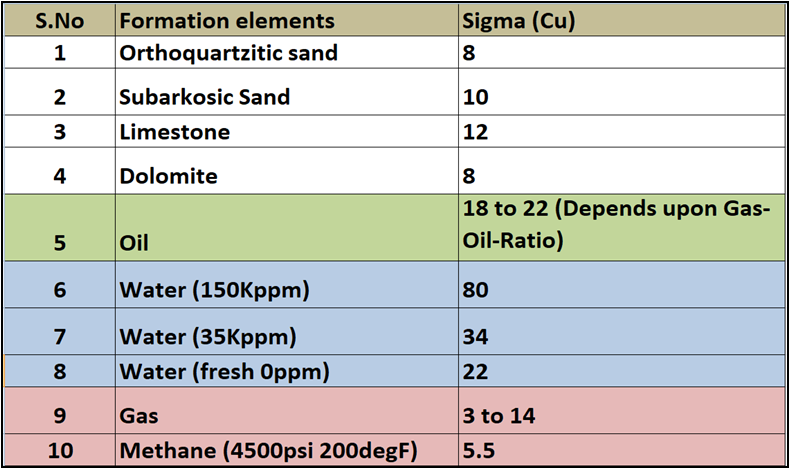
Water Saturation calculation using sigma is more robust in formation having high and known formation water salinity. The reason for this is sigma or capture cross section of fresh water is very close to sigma of hydrocarbon whereas sigma of saline formation water is higher than sigma of hydrocarbon and higher the salinity more the difference between sigma of water as compared with sigma of hydrocarbon. Please see table below for understanding sigma value of various reservoir fluids and lithology:

Looking at sigma of formation fluids in table above, we can easily conclude that sigma of fresh water is almost same as sigma of oil and sigma of fresh water is also close to sigma of gas,although sigma of gas is very low especially at low pressures. This makes water saturation estimation using sigma in fresh water environment impossible in oil reservoirs and high uncertainty in gas reservoirs. As the formation water salinity increases we see increase in formation water sigma also. It implies that water saturation interpretation using sigma has higher certainty in higher salinity formation water.
Charts are available for the estimation of formation water sigma from formation water salinity. However, when chart is not available ,there is a very simple equation to estimate sigma of water from formation water salinity. Equation is given as: Formation water Sigma (Cu) = 22 + 0.404*(Formation Water Salinity in KPPM).
There is one more factor which should be looked at while deciding if estimated water saturation using sigma will give realistic value,that factor is matrix porosity. Higher the porosity more the certainty in water saturation estimation using sigma. There is a thumb rule which combines both salinity and matrix porosity or sigma and matrix porosity to check if water saturation estimation using sigma will be reliable or not.
Thumb rule based on formation water salinity is to multiply formation porosity in Pu with Salinity in Kppm, if answer is more than 1000 sigma,results will be with high certainity, values between 500 to 1000 represents a grey area,sigma should not be used for values less than 500. Mathematically equation is as below:
Effective Porosity (PU) * Salinity (Kppm) = Ans
- If Ans< 500 …………….Not Possible
- If 1000 >Ans> 500 ……Possible (Grey Area)
- If Ans> 1000 ……………No Problem
Other thumb rule based on difference between sigma of formation water and sigma hydrocarbon is to subtract sigma water from sigma hydrocarbon and multiply the result with porosity in Pu. If answer is more than 300 then sigma will give good saturation estimation, whereas answer in the range of 150 to 300 represents grey area and if answer is less than 150 sigma will not work. Mathematically equation is given as below:-
Effective Porosity (Pu)* (Sigma Water – Sigma Hydrocarbon) = Ans
- If Ans<150 …………….Not Possible
- If 300 >Ans> 150 ……Possible (Grey Area)
- If Ans> 300 ……………No Problem
Sigma Interpretation:

In the image above track 1 shows Gamma ray, Track 2 shows inelastic and capture ratio curves and track-3 shows sigma. Looking at sigma response, we can see sigma response against shale is very high, sigma response against gas zone is very low due to low sigma of gas, sigma of oil and fresh water bearing sand is almost same and sigma of highly saline water bearing sand is also very high.
It is worth to note that in the image above, Sigma intrinsic measured by tool is a function of formation fluid in its pores and lithology of formation. So to calculate accurate water saturation we should also know sigma of shale and sigma of matrix, along with sigma of hydrocarbon and sigma of formation water.
Sigma intrinsic recorded can be represented as below:

Above equation can be used to calculate water saturation using Sigma.Parameters needed to calculate water saturation are estimated or directly picked from log. Normally sigma of shale is picked by log in front of 100% shale zone; Sigma matrix can be picked using a sigma trend from 100% shale to 0% shale. Sigma water is estimated from formation water salinity and sigma hydrocarbon is estimated from hydrocarbon type, Gas oil ratio in case of oil and reservoir temperature and pressure in case of gas.
Water saturation estimated using sigma can be compared with base line water saturation estimated using open hole logs to estimate reservoir sweep efficiency. Figure 2 below from 2004 SPE paper shows the example of estimating reservoir sweep efficiency using Sigma. Production logging data is also used to enhance interpretation.

Sigma interpretation is itself a big topic; we have tried to cover important parts as much as possible. In order not to make article bulky we have cut down on some cross plots, images and explanations. We would like to hear from our readers, please do comment or if you like to do one on one discussion with author please email us at support@oilfieldknowledge.com